Back in 1952, after the unexpected death of her father, King George VI, 25-year-old Princess Elizabeth ascended to the British throne.
Over the last 70 years, the Queen has been a constant through good times and bad, and the celebrations of Her Majesty’s Platinum Jubilee have given us the opportunity to reflect on her long years of service.
It also makes you wonder about how the world has changed during the longest reign of any British monarch.
So, let’s have a look at how our financial lives have changed since the Queen took the throne.
The value of your home will have risen by 139 times
The average UK house was valued at £1,891 in 1952. Now, research from Savills shows that house prices are more than 130 times higher than they were when Queen Elizabeth II ascended to the throne, or almost four times higher (365%) when taking inflation into account.
The chart below shows house price growth in the UK during the Queen’s reign, showing sharp rises from the late 1990s onwards:
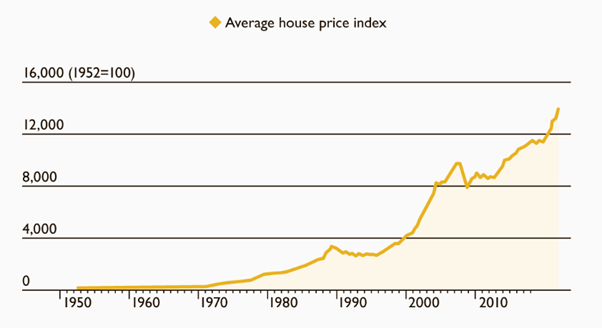
Source: the Times
A pint of milk for less than 5p
In a time where inflation and the rising cost of living are constantly in the headlines, it’s almost dizzying to reflect on how things were financially when Her Majesty took the throne.
In 1952, a pint of milk cost just four pence, while it cost just three halfpence to send a letter.
If you intended to enjoy a pint of beer to celebrate Queen Elizabeth’s ascension to the throne, you could have popped down to your local pub and paid the bartender just nine pence.
According to the Bank of England inflation calculator, inflation averaged 4.5% a year between 1952 and 2021. So, £10 of goods and services in 1952 would have cost you £202.30 in 2021.
The money itself has changed
One of the most significant changes to personal finances since the Queen ascended to the throne happened on 15 February 1971. On that Monday, the UK converted to its new decimal currency.
For the first almost two decades of the Queen’s reign, there were 12 pennies to the shilling and 20 shillings to the pound. There were guineas, crowns, half crowns, threepenny bits, tanners, and florins.
The Royal Mint issued the first decimal coins in 1968 to give the public the opportunity to get used to them before the old system was scrapped. A two-year public information campaign also prepared the nation for the switch, and there was even a decimalisation song by popular singer Max Bygraves.
The £1 note was then withdrawn in 1988 and replaced by a coin, and the £2 coin came into circulation in 1998.
Oddly, you probably see the Queen’s face less now than ever before
At the time the Queen came to the throne, Brits paid for goods and services in cash. However, by 2020, the Bank of England (BoE) say that just 17% of all payments were made using notes and coins.
The first BoE note to feature the Queen’s portrait was the £1 note issued in 1960, followed by the 10-shilling note in 1961.
Paying in cash became easier in 1967 with the launch of the UK’s first cash machine, before cheques grew in popularity throughout the 1980s, peaking with 4 million written in 1990.
Barclays issued the UK’s first credit card in 1966 and the first UK debit card in 1987. Nationwide Building Society introduced internet banking in 1997, and cash usage further diminished with the introduction of “chip-and-PIN” payments in 2003 and contactless cards in 2007.
Tax-efficient savings and pensions: some things have changed for the better
Of course, just because prices are higher, doesn’t mean things haven’t changed for the better, too.
Back in the 1980s, to encourage higher share ownership, chancellor Nigel Lawson introduced the Personal Equity Plan (PEP), which enabled savers to invest up to £6,000 tax-efficiently.
Four years later John Major introduced the Tax-Efficient Special Savings Account (TESSA) to further encourage tax-free saving.
These two schemes were superseded by ISAs in 1999, and since then the amount of tax-efficient savings individuals can accumulate each year has risen to the 2022/23 level of £20,000.
The 1980s also saw the introduction of personal pensions, which enabled individuals to save more flexibly for retirement.
The State Pension has also been a constant over the last 70 years. According to Royal London data, in 1952, the basic rate State Pension was £1.63 a week for a single person. Married couples received £2.70 a week, or just over £140 a year.
Now the basic State Pension is £141.85 a week for a single person and £226.85 for a married couple where only one spouse has a sufficient NI record. Meanwhile, this is £283.70 for a married couple where both spouses have sufficient NI records.
The State Pension was 31% of average earnings when the Queen ascended to the throne. It is now 23%.
Speak to us
If you’d like help managing your money, whether that’s for the next seven or 70 years, please do get in touch with us at Rosebridge.
Email enquiries@rosebridgeltd.com or call 01204 300010 to find out how we can help you secure your wealth.
 Rosebridge® is a trading style of IFA (North) LLP, Pro Sport® Wealth Management Ltd, Stonebridge Wealth Management Ltd and Independent Financial Advisor Limited. IFA (North) LLP, Pro Sport® Wealth Management Ltd and Stonebridge Wealth Management Ltd are all appointed representatives of Independent Financial Advisor Limited which is authorised and regulated by the Financial Conduct Authority. Registered in England and Wales No 05246224. Registered address: The Grants, 11 Market Place, Ramsbottom, Bury, BL0 9AJ.
 Production